Know it's down before your customers do.
Uplance checks your websites, APIs, databases and background jobs around the clock, keeps your customers informed on a status page, and makes sure the alert actually reaches you.
Free for 10 monitors · no credit card
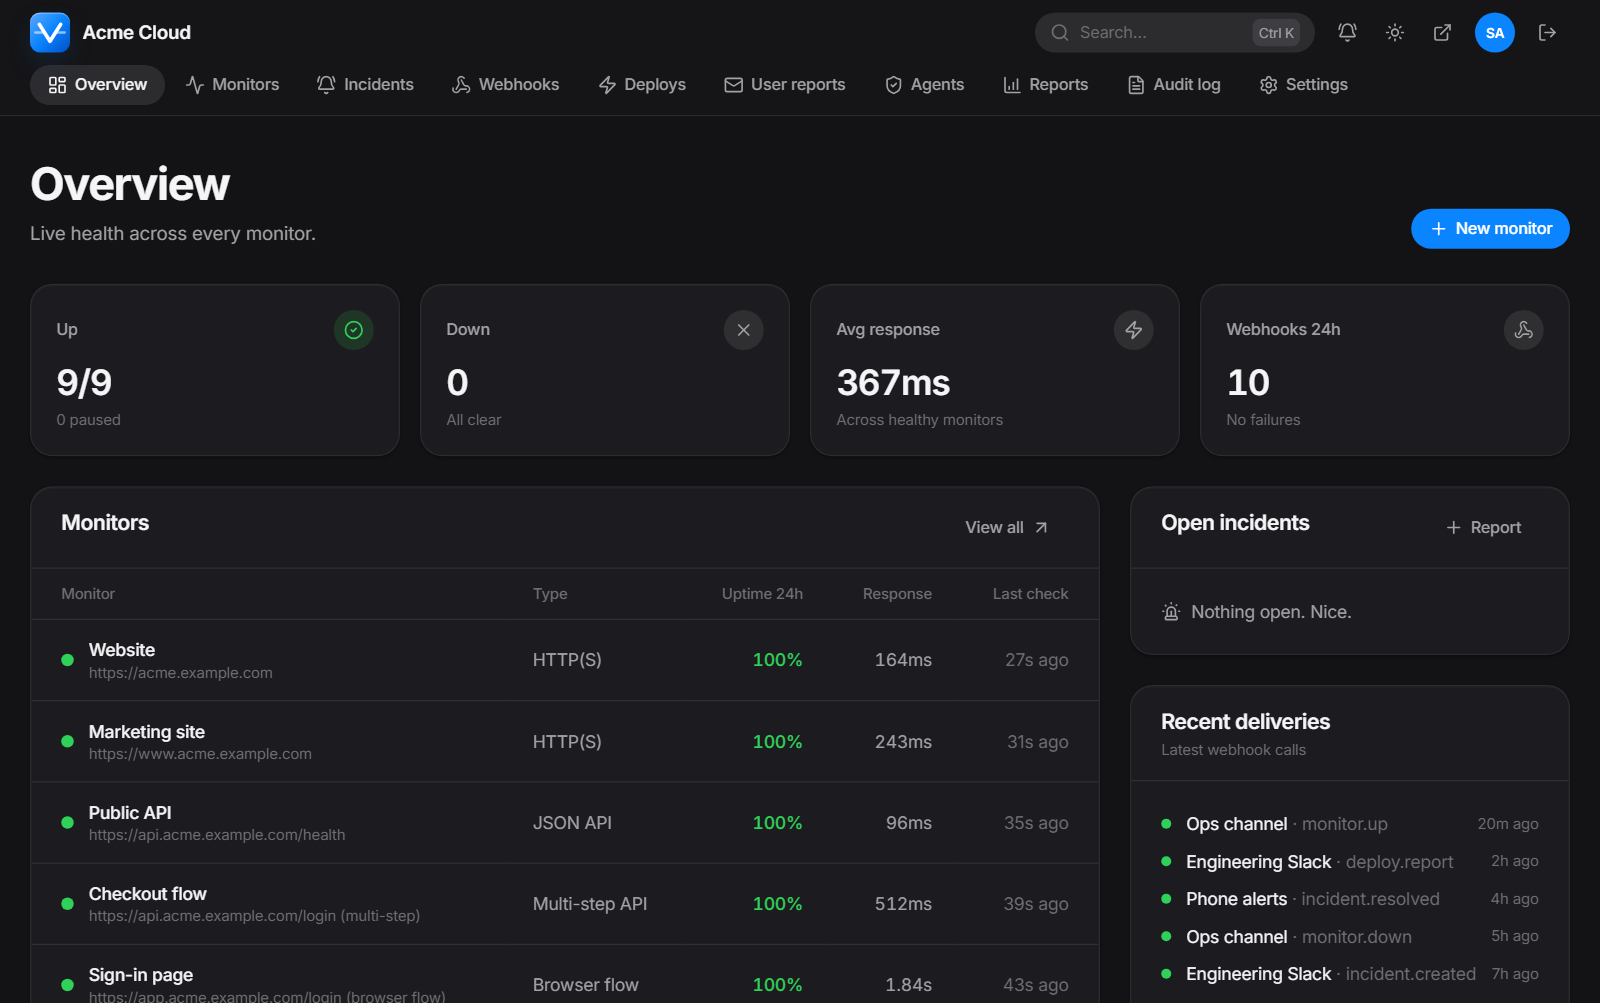
- Websites & APIs
- Browser flows
- Databases
- Discord bots
- Game servers
- Cron heartbeats
Everything between “it's down” and “it's fixed”.
One place for checks, alerts, incidents and the page your customers look at.
Fifteen kinds of checks
HTTP, keyword and JSON assertions, multi-step API flows, real browser flows, TCP, ping, DNS, Postgres, MySQL, Redis, heartbeats, blocklists and more.
Status pages on your domain
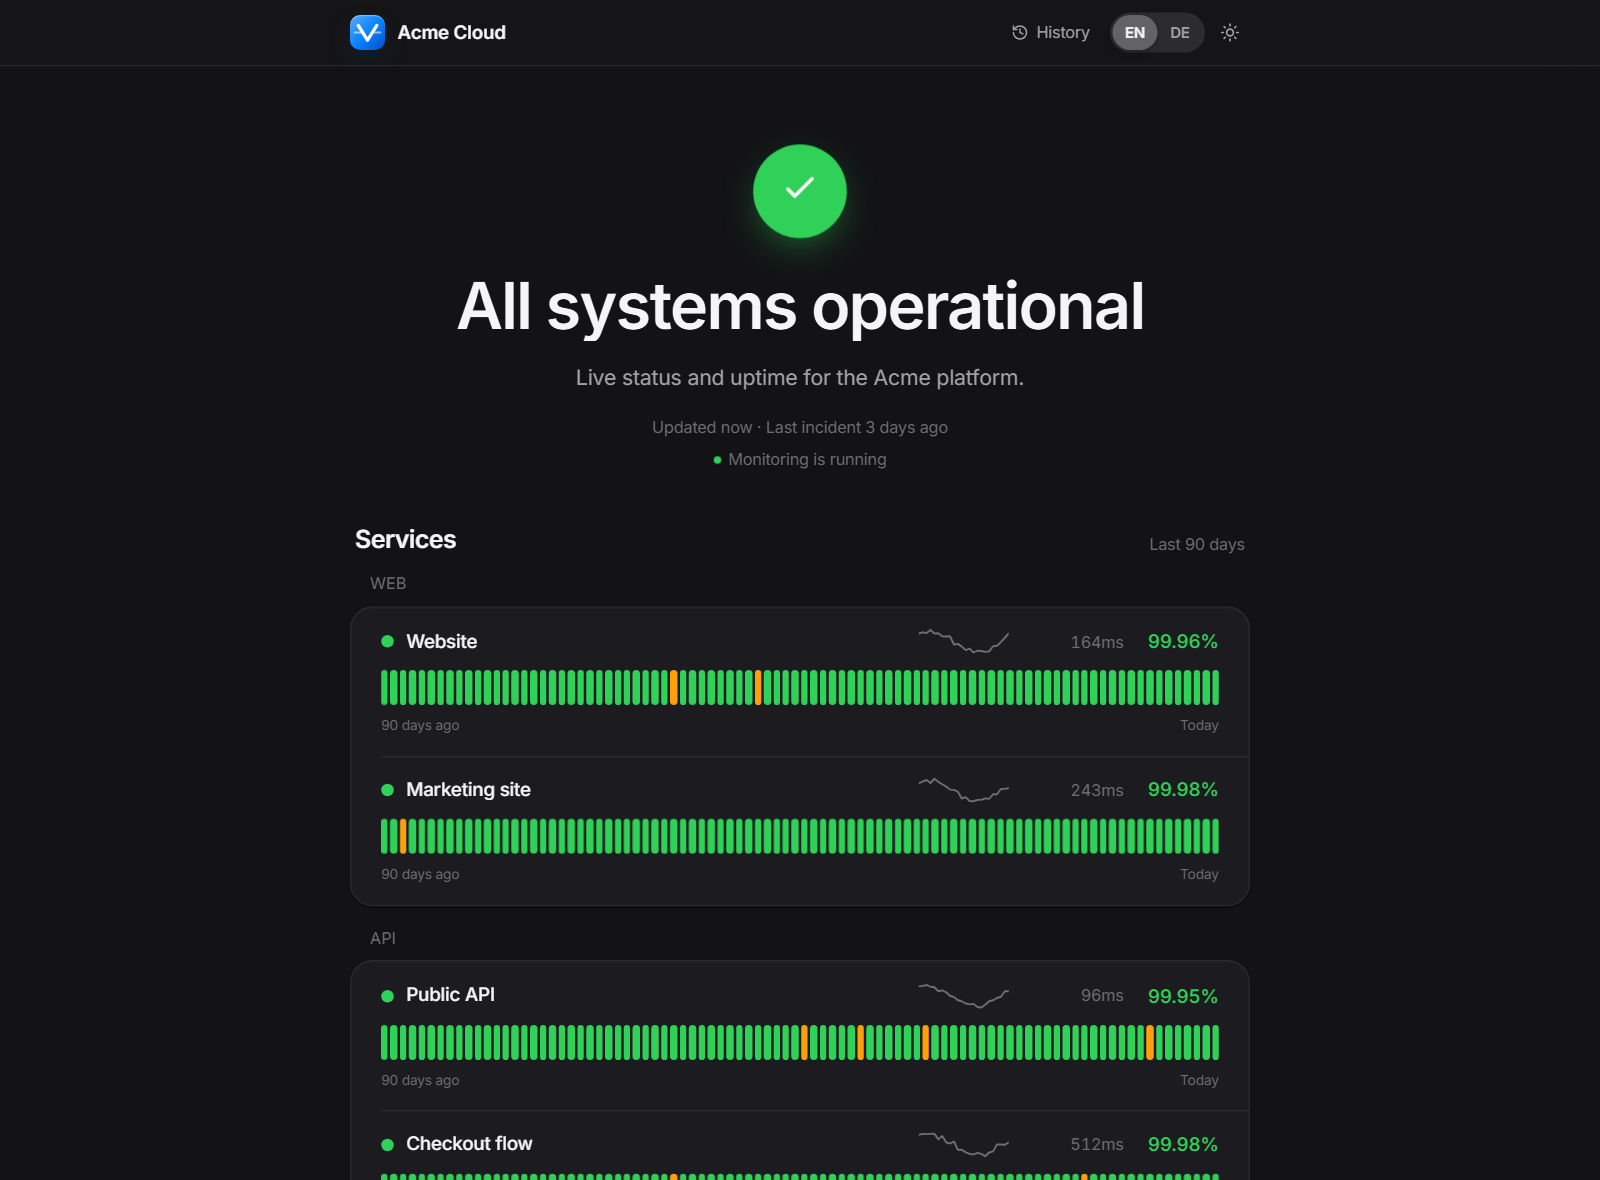
A fast public page with 90-day uptime bars, incidents, maintenance and post-mortems, in English and German, on status.yourcompany.com with automatic HTTPS.
Alerts that can't fail silently
Every alert is written to an outbox before it's sent and retried for 50 minutes. If a channel breaks, the dashboard tells you, not a log file.
Incidents with a timeline
Incidents open themselves when something goes down, capture DNS, TLS and route evidence, and turn into a post-mortem you can publish.
Fewer, better alerts
Retries before paging, dependencies, flap detection, maintenance windows, quiet hours, anomaly detection and escalation when nobody acknowledges.
API, YAML and Terraform
Manage monitors from CI with a REST API, keep them in uplance.yaml, or use the Terraform provider. Mark deploys and hold alerts during rollouts.
A status page people actually believe.
When something breaks, the page leads with it: what's affected, the latest update, and how long it lasted. Visitors can follow updates in their own Discord or Slack channel, subscribe by RSS, or tell you something's wrong before a check notices.
- Your logo, colours and domain
- 90-day uptime and response times per service
- Incident history, maintenance and post-mortems
- “Having problems?” reports that raise an alert
Built for the day the alert matters.
Most monitoring tools are fine until the one time the alert doesn't arrive. Here's what happens in Uplance.
- 01
Confirm
A failed check is retried within seconds, and optionally confirmed from a second location, before anyone is paged.
- 02
Record
The alert is written to an outbox first. A crash or restart can't lose it.
- 03
Deliver
Sent to every channel, retried for 50 minutes, with each attempt logged.
- 04
Escalate
Nobody clicked “I'm on it”? Everyone with admin access is pulled in.
Simple pricing.
Start free. Upgrade when you need faster checks, more monitors or your own domain.
Free
€0 / month
Free forever
- 10 monitors
- Checks every 3 min
- 3 team members
- 30 days of check history
- Hosted status page
- Scheduled maintenance
- API, TCP, DNS and heartbeat checks
- 1 remote agent
Pro
Most popular€19 / month
or €190 a year · incl. VAT
- 50 monitors
- Checks every 1 min
- 10 team members
- 90 days of check history
- 1 custom domain
- 3 status pages
- Browser flow checks
- 5 remote agents
Business
€79 / month
or €790 a year · incl. VAT
- 250 monitors
- Checks every 30 s
- 50 team members
- 365 days of check history
- 10 custom domains
- 21 status pages
- SAML single sign-on
- Browser flow checks
- 25 remote agents
Security isn't a feature page. It's the architecture.
A monitoring service connects to your infrastructure and holds your credentials. We treat that seriously.
Isolated workspaces
Every query is scoped to your workspace in one place, so a missed filter can't show another customer's data.
No reaching into private networks
Checks and webhooks refuse private, loopback and cloud-metadata addresses, and re-check every DNS answer and redirect.
Accounts that hold up
Argon2id passwords, passkeys, two-factor codes that can't be replayed, SAML single sign-on, account lockout, and sessions you can see and end.
Secrets encrypted at rest
Database credentials and 2FA secrets are encrypted with AES-256-GCM; API keys and session tokens are stored only as hashes.
Found a problem? Report it privately.
Questions
- What happens if the monitoring itself goes down?
- The checker writes a heartbeat every few seconds. If it stops, your status page says monitoring has stopped instead of showing stale green, and the public health endpoint fails so an outside service can page us.
- Can I use my own domain for the status page?
- Yes, on the paid plans. Add a TXT record to prove you own the domain and a CNAME to point it here; certificates are issued automatically.
- Can I monitor services inside my private network?
- Not from our servers — they refuse private addresses on purpose. Run a remote agent inside your network instead: one file, no dependencies, and it reports results back.
- Where do alerts go?
- Email, Discord, Slack, Telegram, ntfy, Microsoft Teams, signed JSON webhooks, and push notifications to your phone or desktop straight from the dashboard.
Set up your first monitor in a minute.
Paste a URL and Uplance suggests the checks worth having — website, content, DNS and certificates.
Start free